 |
|
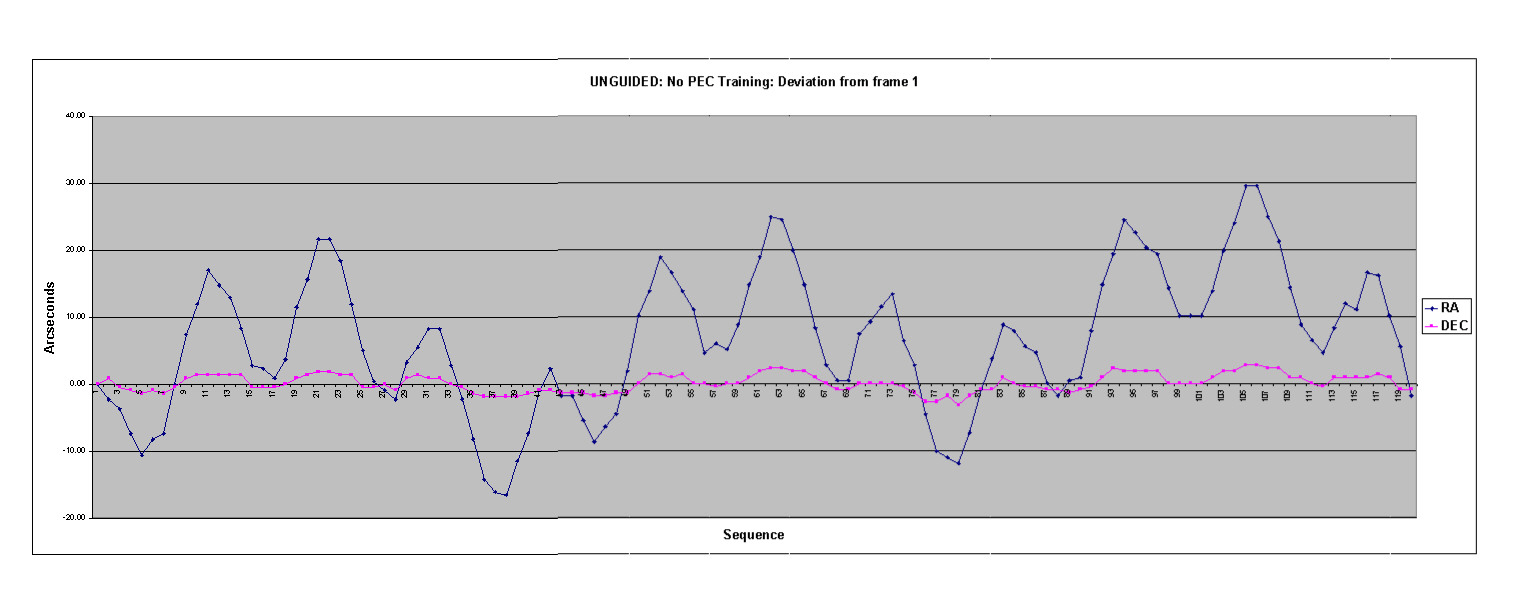
This plots the swing in RA relative to the position of the target star as it was in frame 1. The tracking measured here was with NO PEC training, basically a snapshot of how well my worm gear tracks. The data comes from measurements of the centroid of a star tracked 120x10 second images. Using data from 20 minutes of tracking ensures that data came from more than 1 turn of the worm gear, and more than one tooth of the main RA gear. Maximum deviation is very near 30 arcseconds, very jumpy.
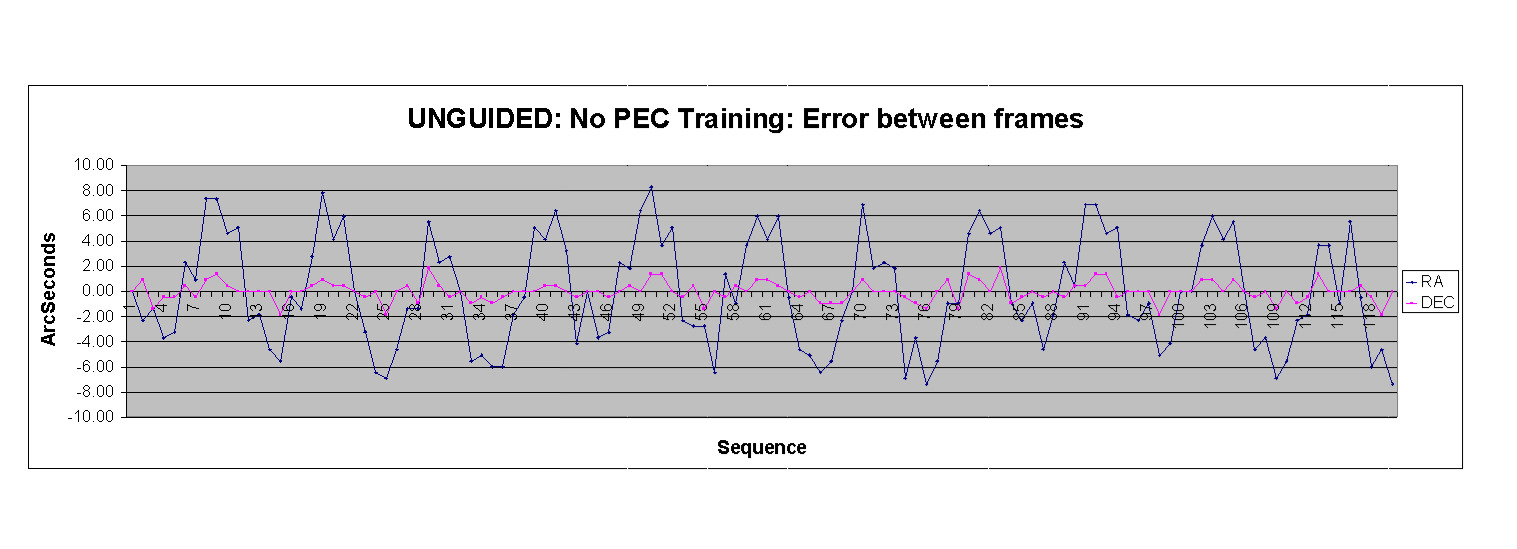
The graph below plots the same data in a different way. In this chart the data points show the difference between frames. This is useful to see the maximum jump during any given 10 second time frame. This also shows the remarkable regularity of the error, with a period repeating almost exactly every 60 seconds. Maximum error regularly shows swings of up to 8 arcseconds during 10 second frames!